The urban development of Luxembourg from the mid-16th century up to recent times still remains largely unexplored. A surprising fact, as Luxembourg has undergone particularly profound processes of change compared to other European cities. From a medieval town of medium size to an early modern fortified city, which could rid itself of its inhibitory military corset only after 1867, on to a modern European capital of the early 20th century and after World War II to one of the three capitals of the EU and an international financial centre.
Since 2016, a research project of the University of Luxembourg at the Institute for History (IHIST) in close collaboration with the city of Luxemburg is investigating research into the development of an interactive, dynamic website, providing insights into the history of the urban development at single building level scale.
Part of an international research network
Luxatlas is part of the research network on Historical Town Atlases (HTAs) in Europe, a project, that was launched by the International Commission for the History of Towns (ICHT) in 1955. It is coordinated by the Atlas Working Group of the ICHT. The basic research idea was to use town plans as a means of understanding urban development. Because they allow insights into phases of urban growth and enable comparative studies of the historical topography of European towns. The project became a unique success story: With well over 520 published volumes to date.
Most of the HTAs published so far are available in printed form, as large-format folders containing folded maps, picture panels and text booklets. Luxatlas is one of the first to opt for a completely digital and interactive publication, based on open-source software, intended solely for online publication on the Internet.
Outcomes
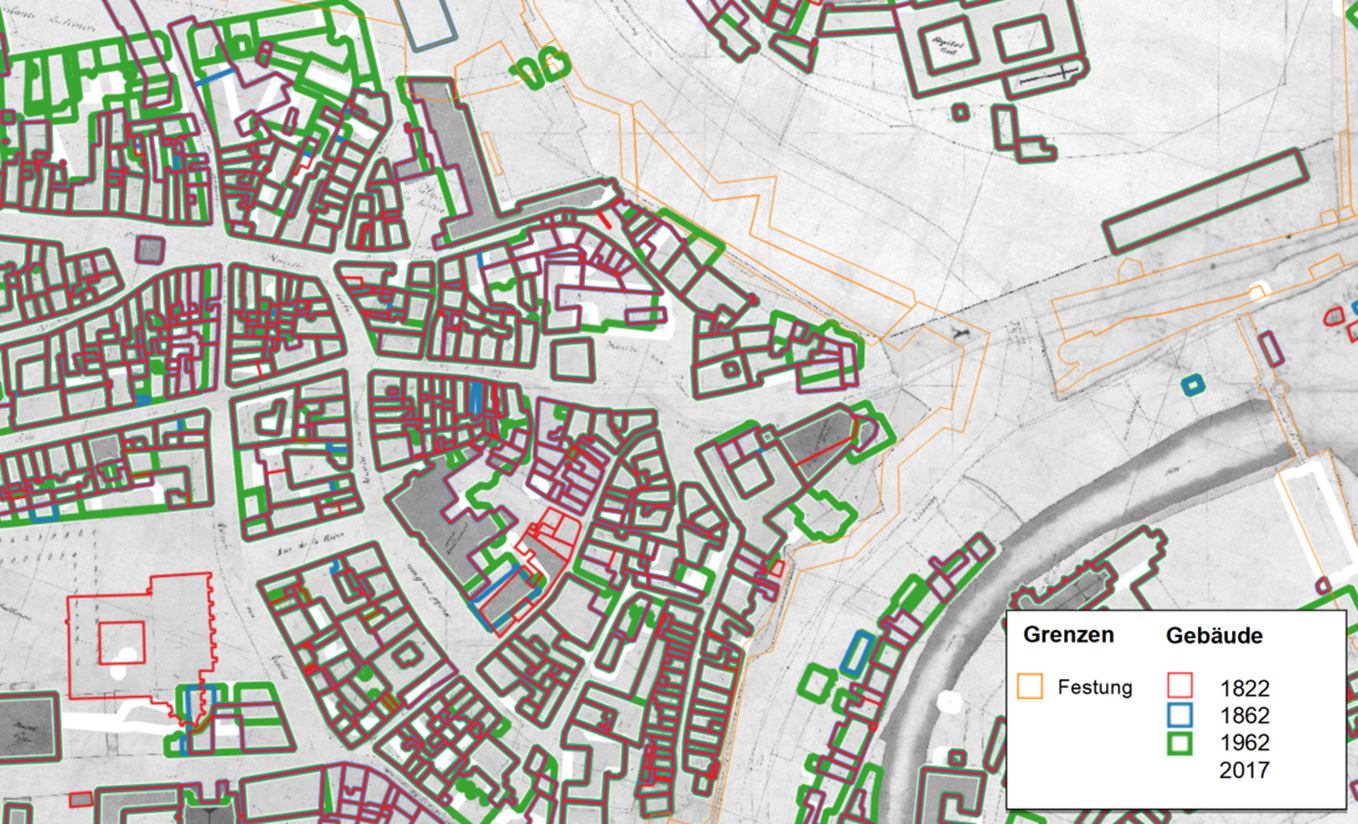
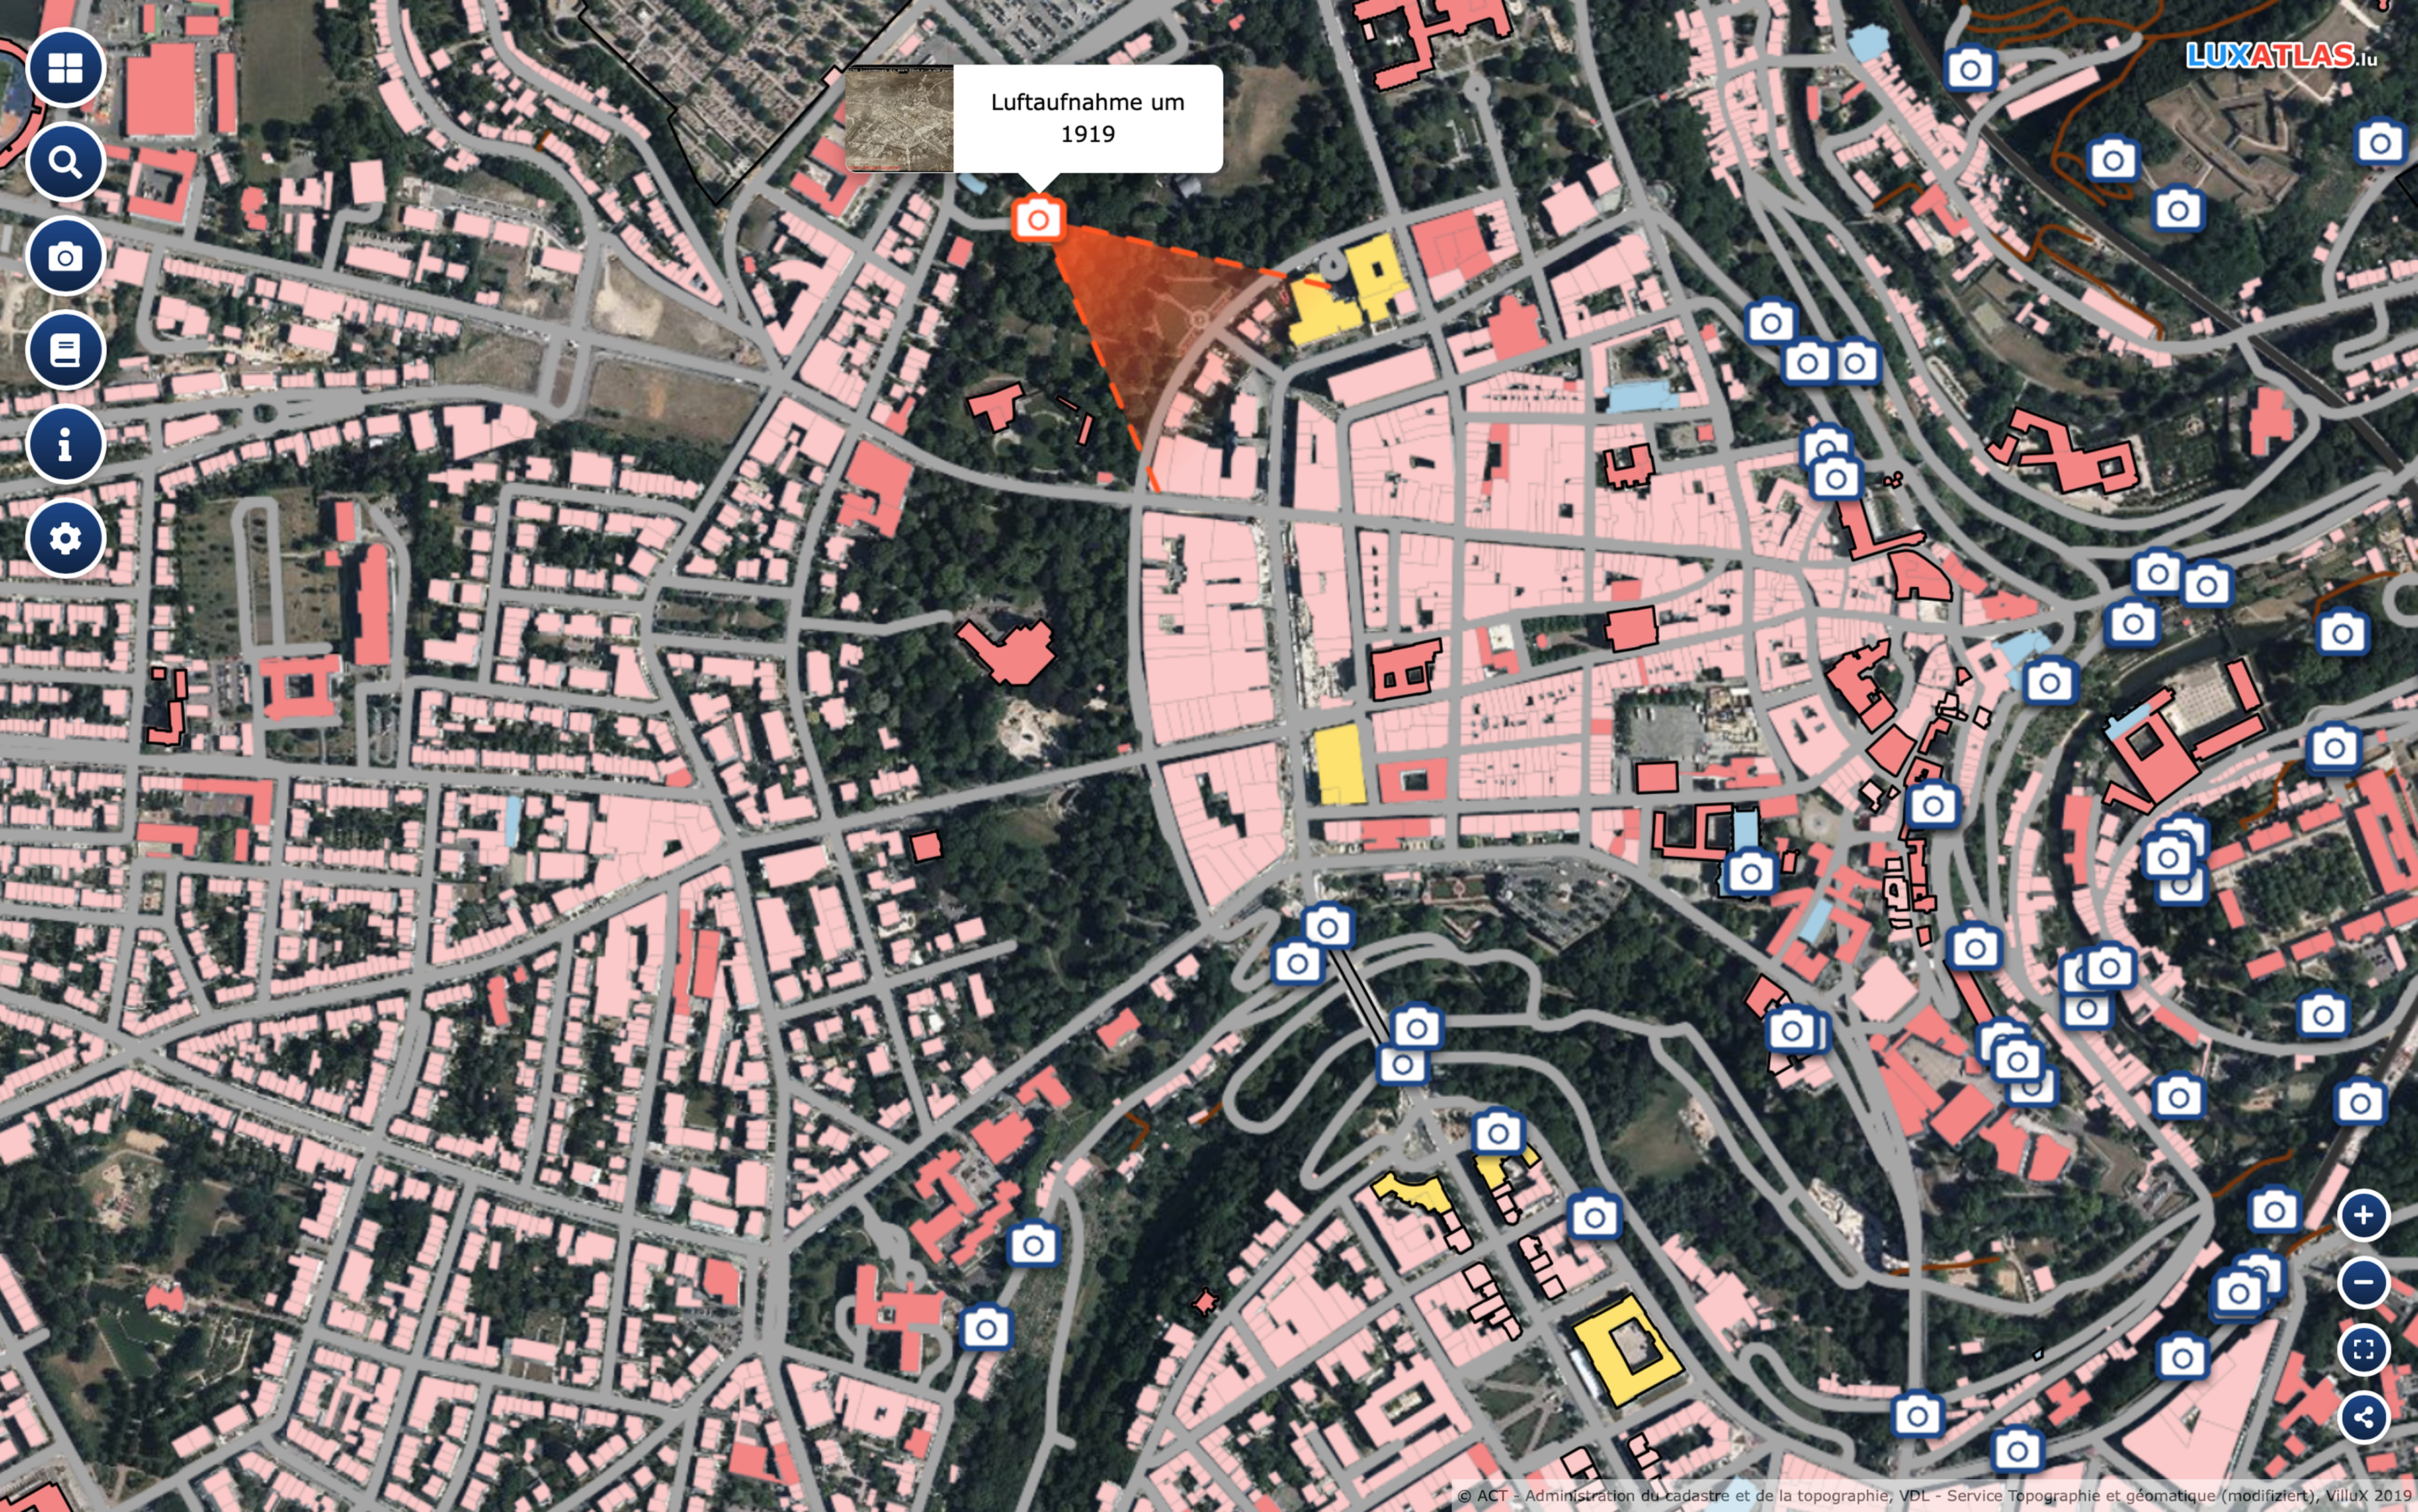
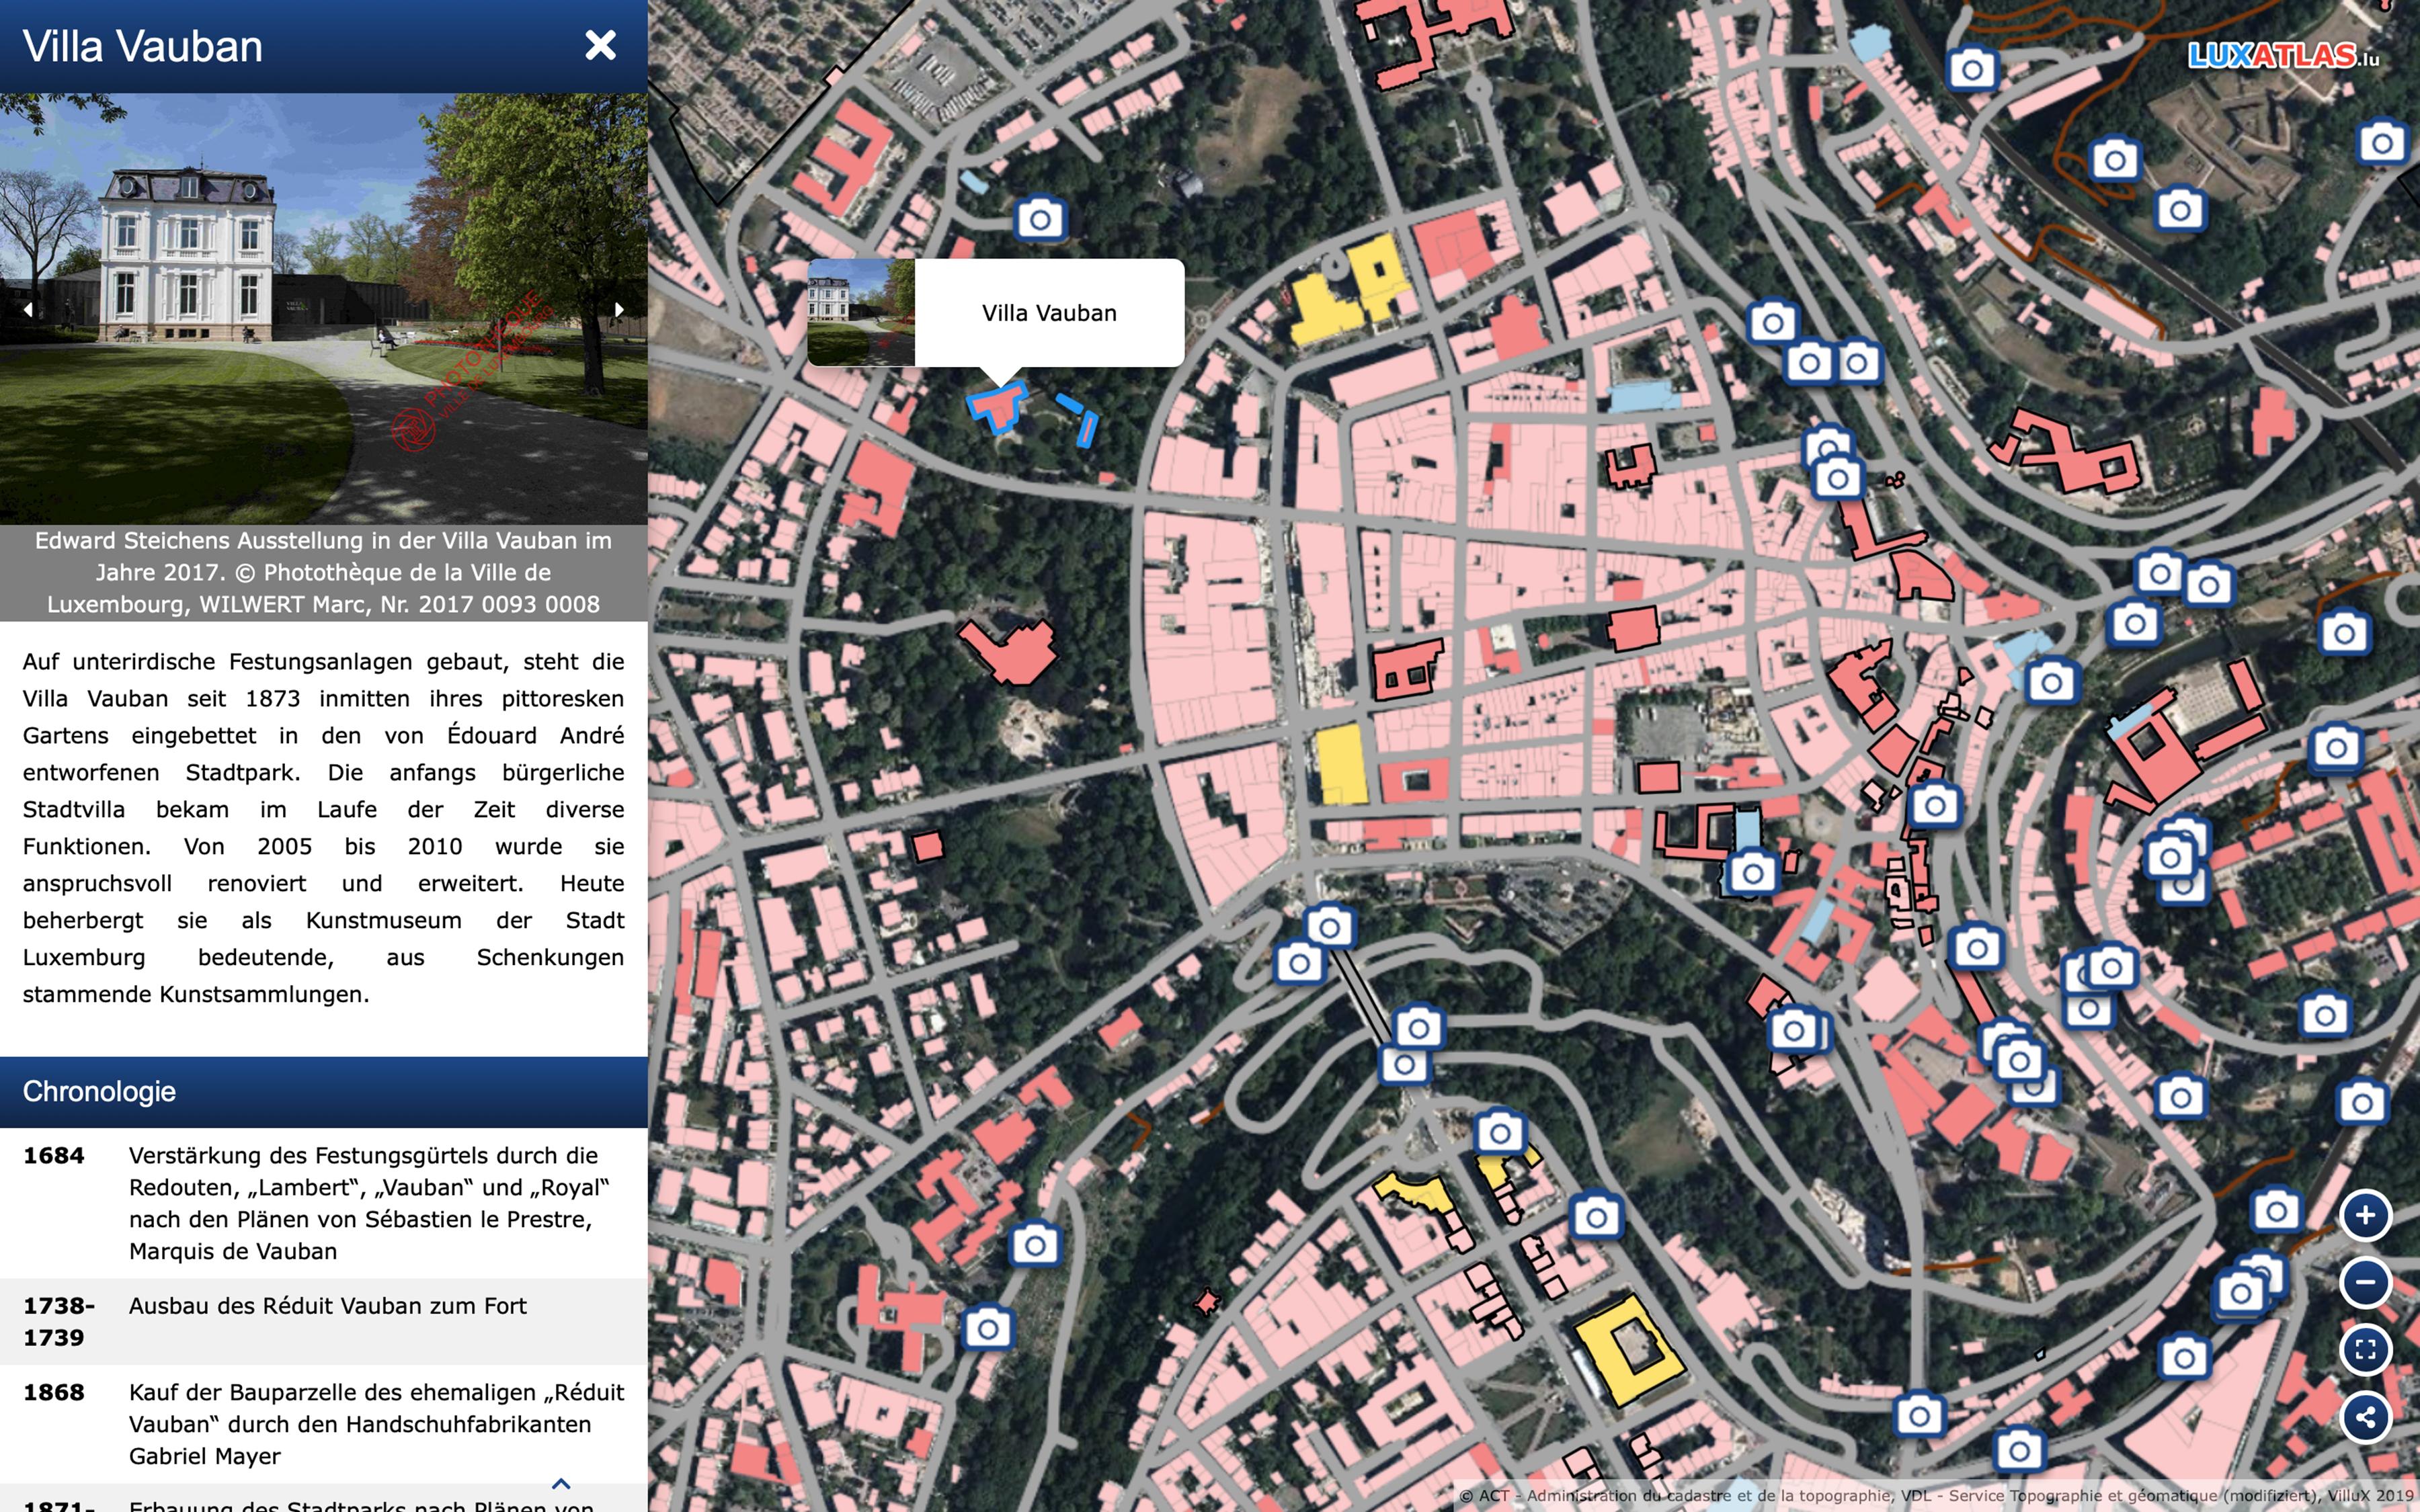
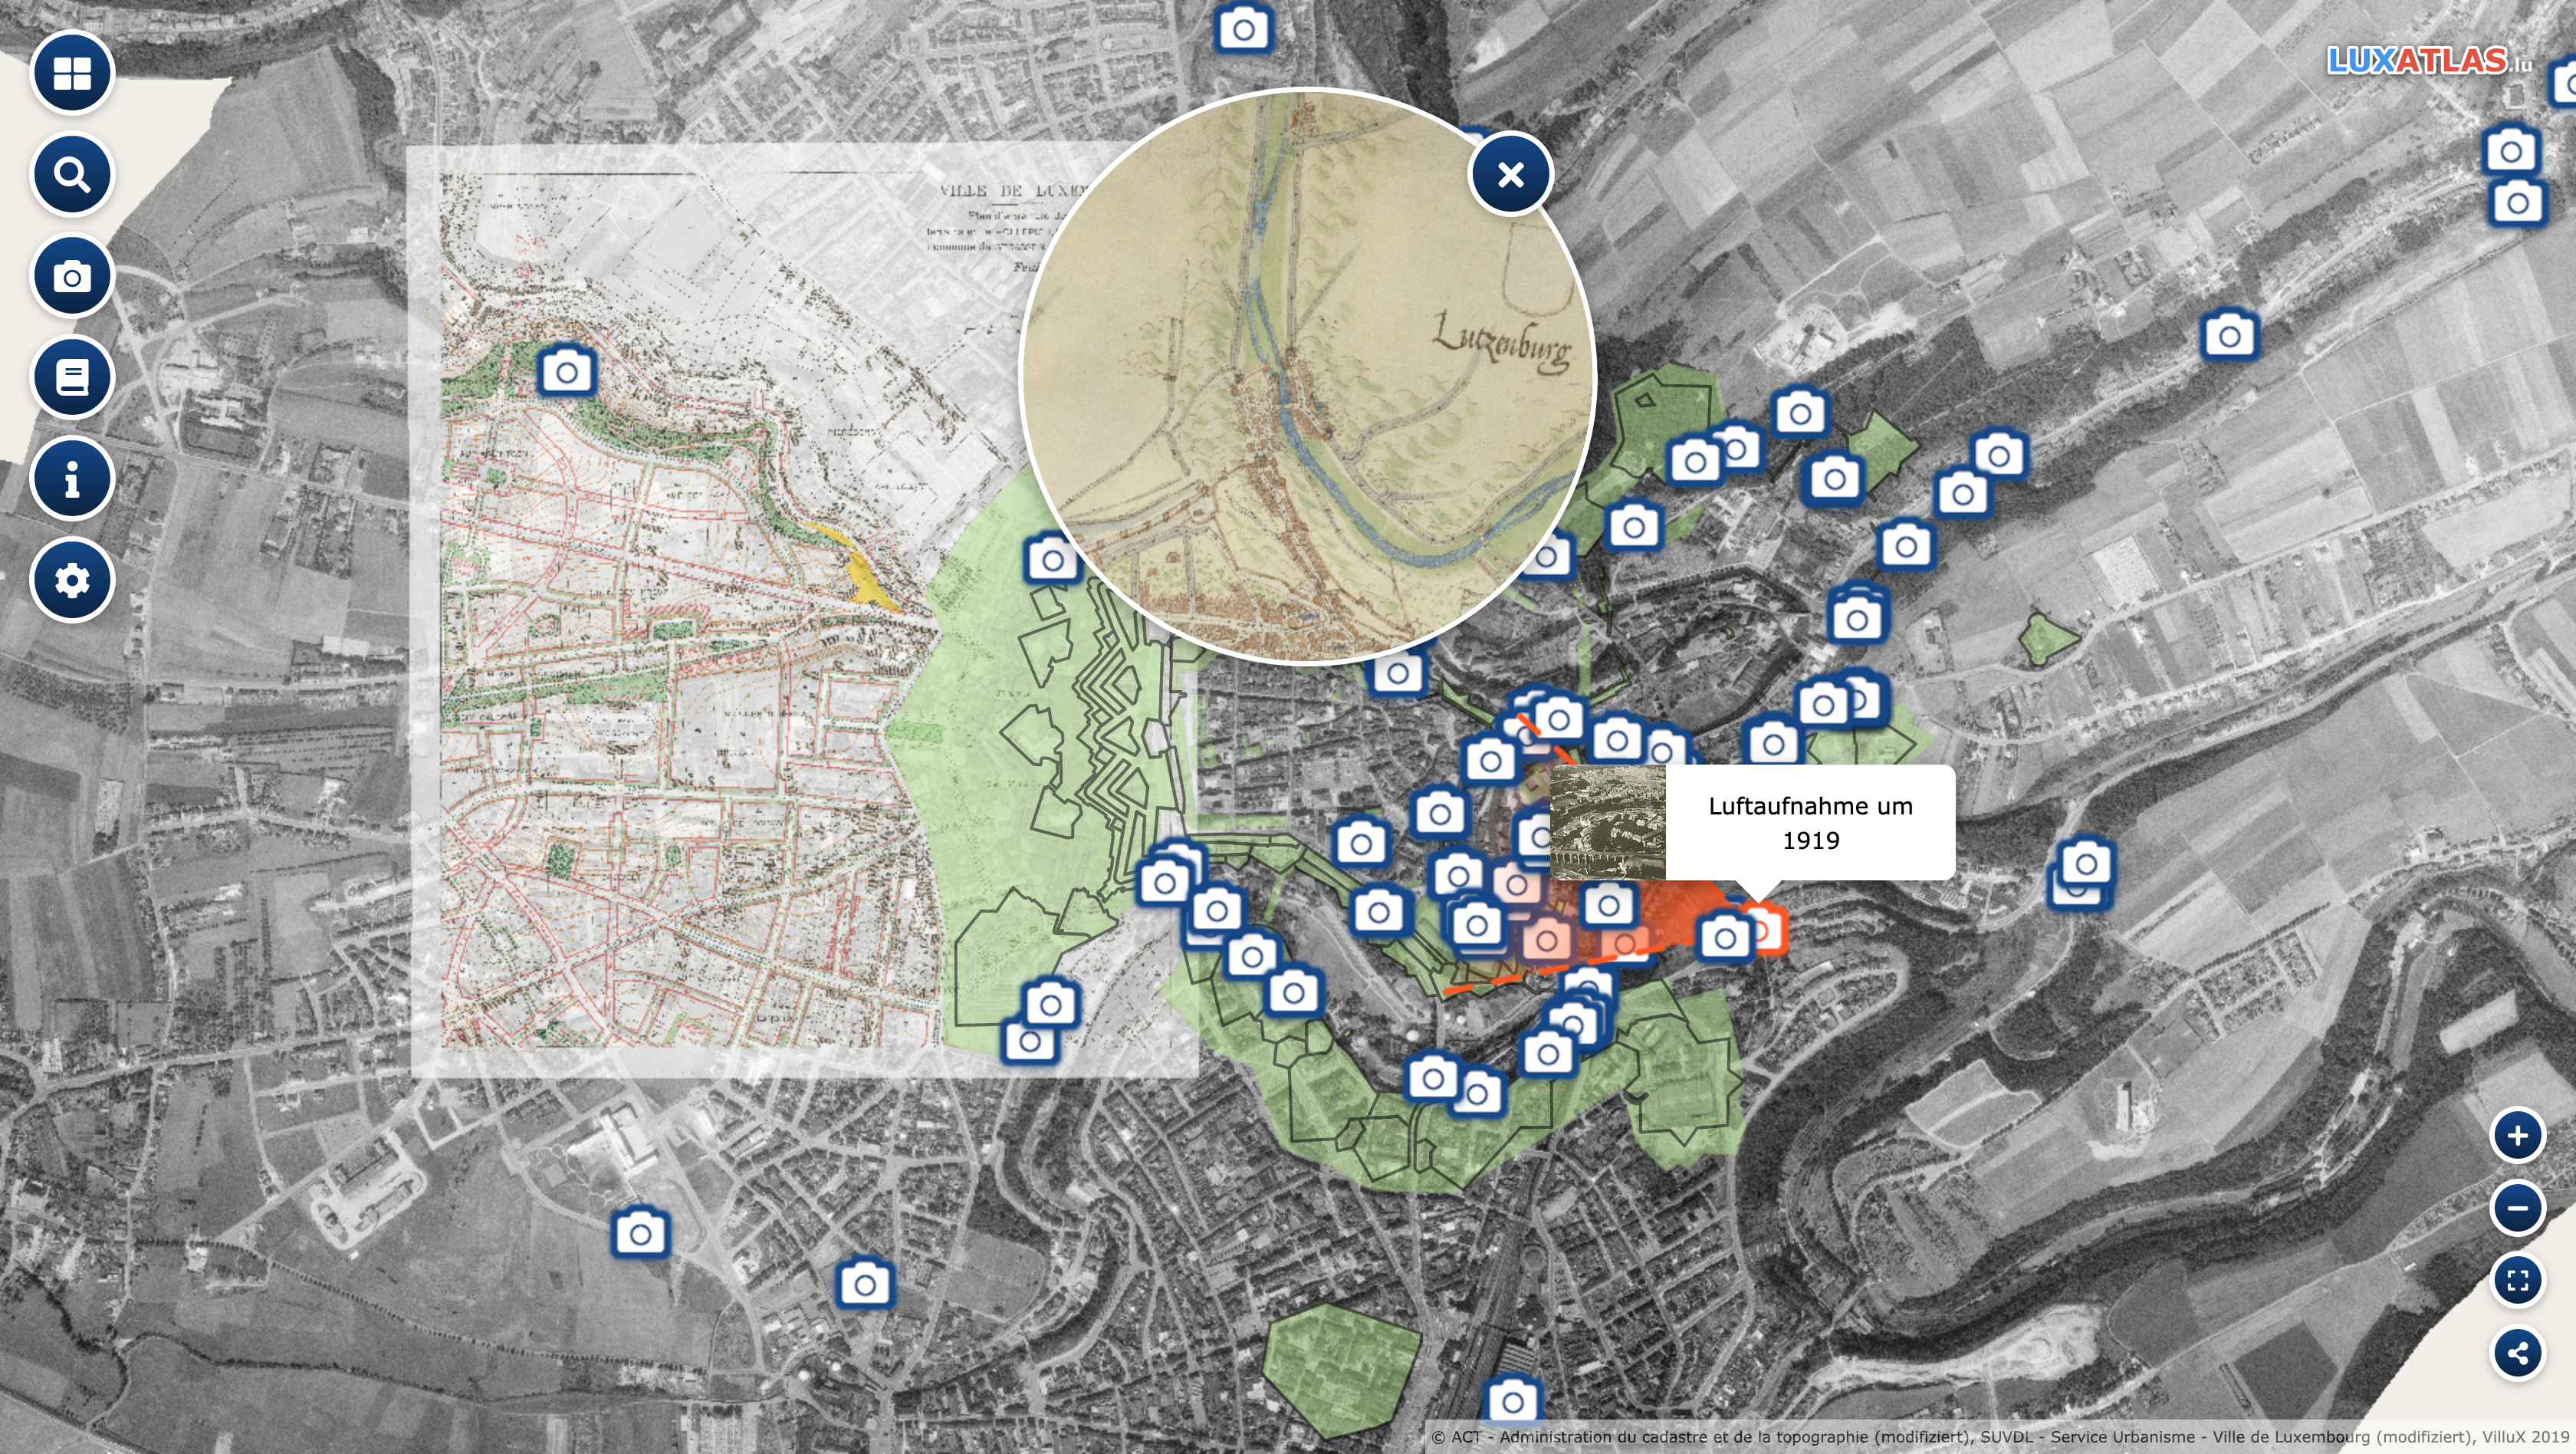
The Luxatlas represents a collection of maps and structures (e.g., building, fortress, streets) combined with explanatory texts, chronological tables and images. On this basis, the historical town atlas documents historical processes of change diachronically for research purposes and education (university and school), for people interested in history (public history) and for municipal departments (supporting preparations for urban development projects). But the pure visualisation of research results is not the main focus of the project. The town atlas itself serves as an important tool for the acquisition of new knowledge. It is only by means of cartographic representations that comparisons can be made of various historical development processes in Luxembourg. The superimposition of different cartographic time layers enables users to visualise and analyse specific questions individually. The town atlas, therefore, offers a basis for further research on urban development. It is only through the cartographic presentation of historical, architectural, economic and urban development information that the distribution of certain spatial phenomena becomes visible and can then be interpreted and analysed. In this way, the interactive map becomes a central instrument for acquiring additional knowledge.
Meanwhile, a large number of texts, several hundred photos as well as 63 map layers and 3 story maps have already been published within the Luxatlas.
Converting analogue data into interactive digital maps
The realisation of the project mainly consists of two parts:
- The collection, pre-processing and digitization of historical maps, plans and other data from the mid-16th century until today and
- The exploration, setup and visualization of an interactive mapping tool as a web-atlas.
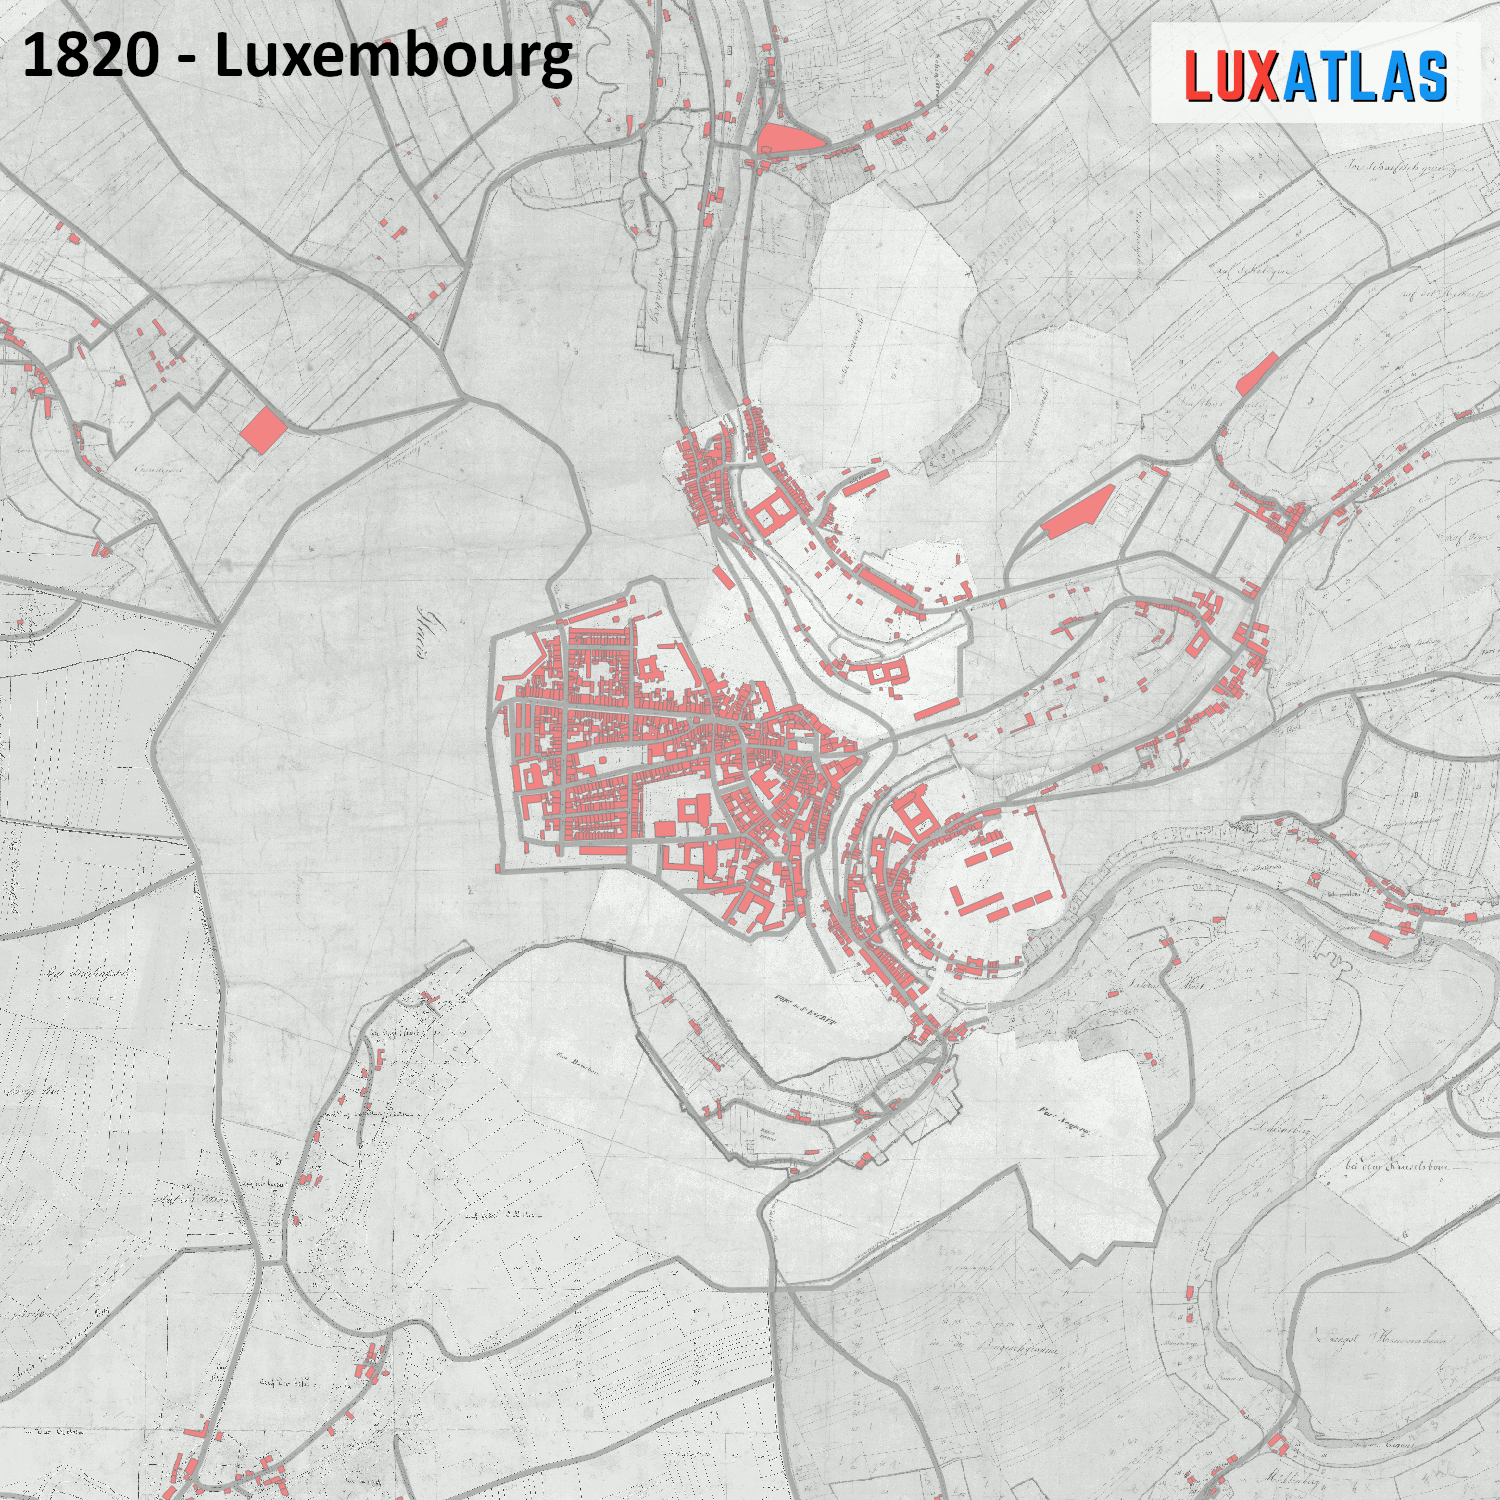
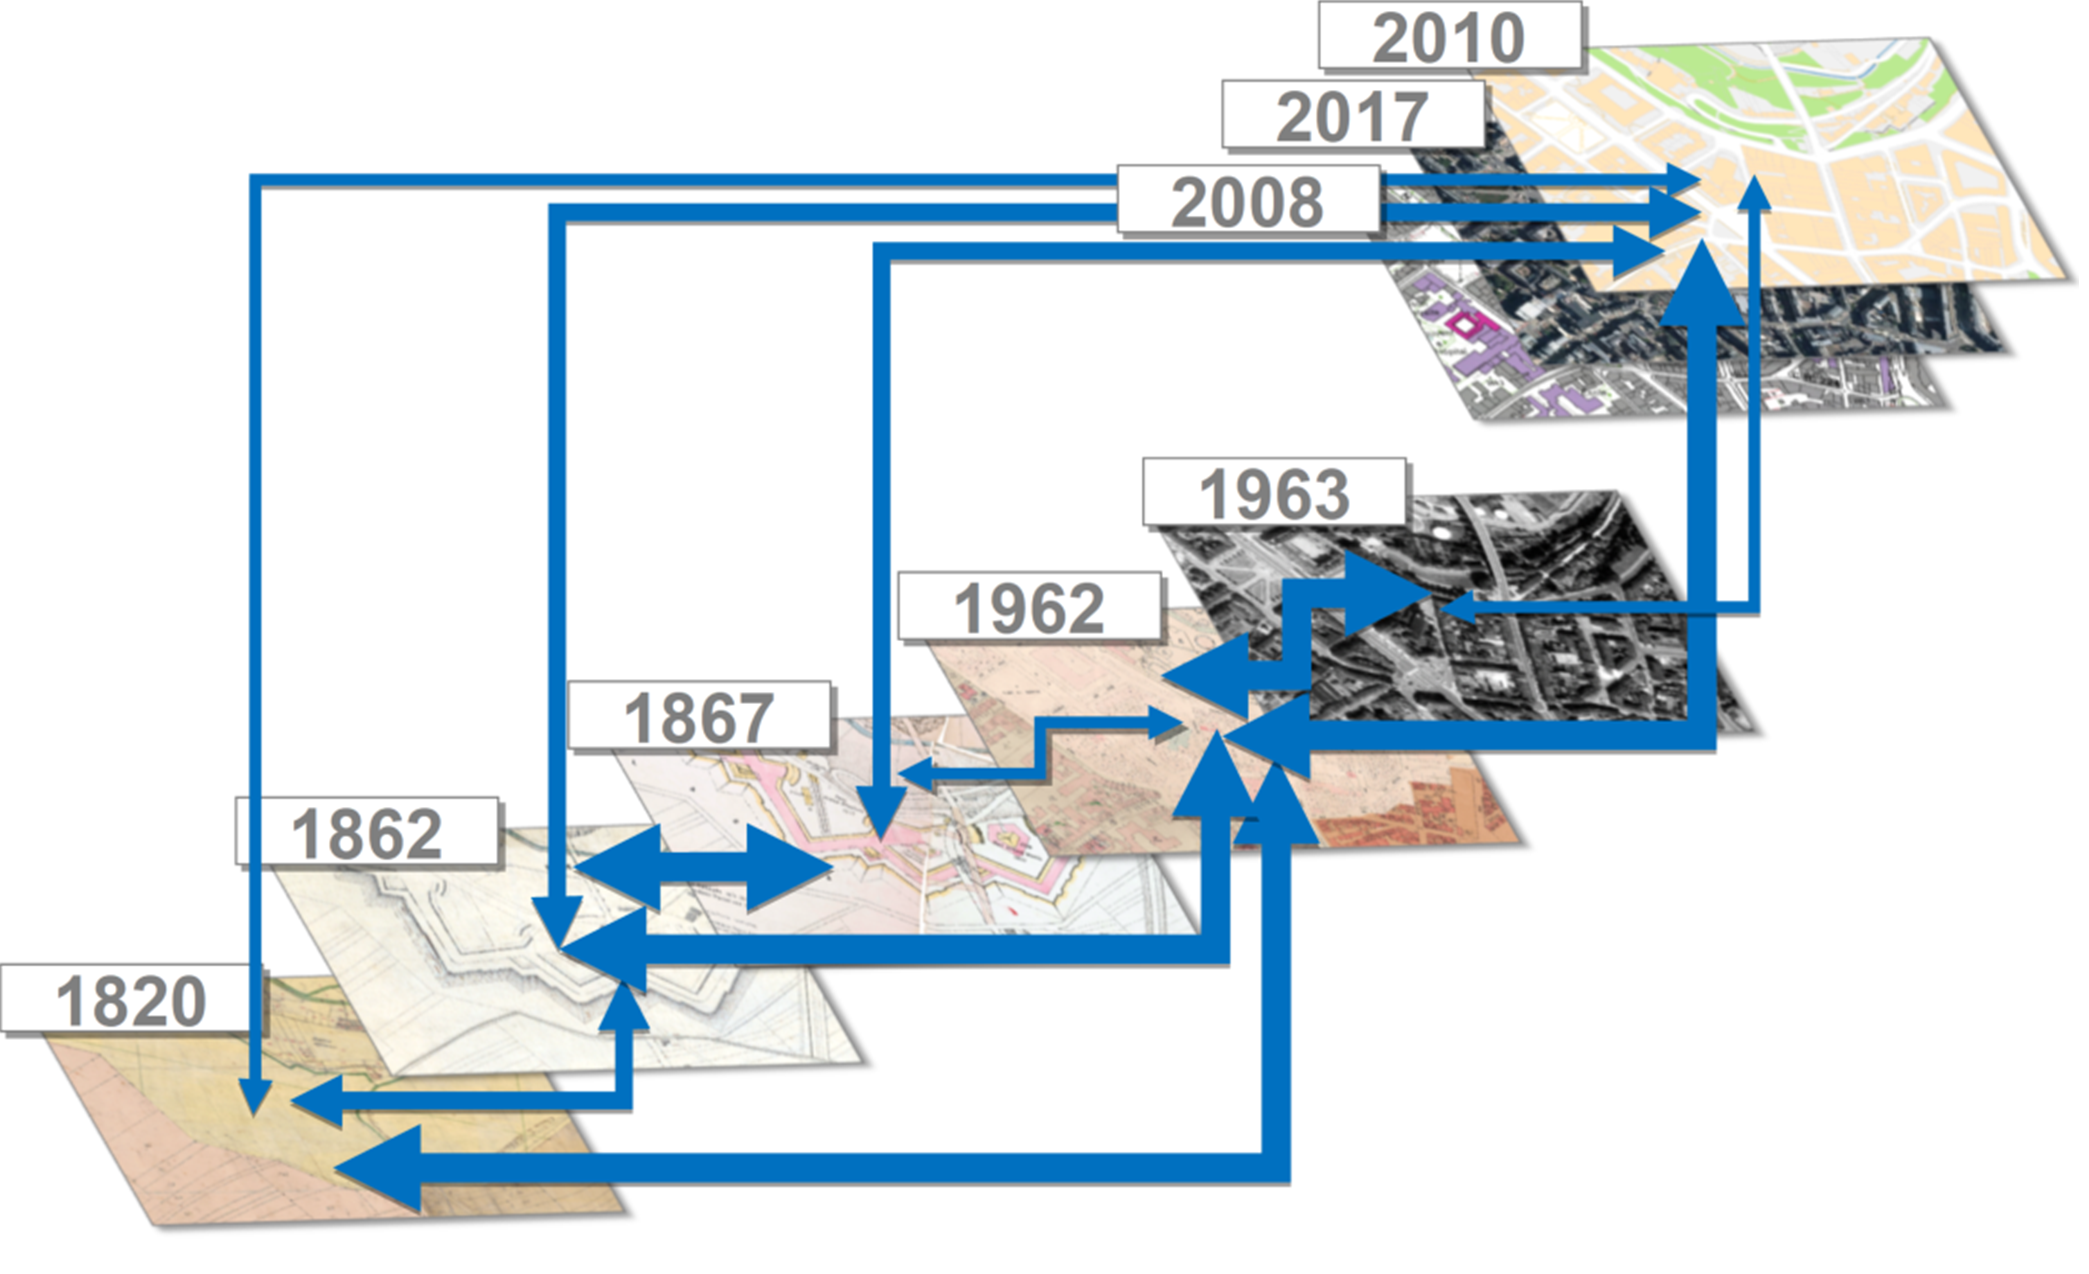
Within the primary part, historical maps and aerial photos have been geo-referenced, harmonized and digitized illustrating the state of Luxembourg within today’s municipal boundaries. For the years 1820, 1862, 1867, 1962 and 2017, we were able to base our work on cadastral maps whose accuracy extends to the building ground plans. Due to the unsatisfactory record of sources, we were not able to determine further high-resolution maps with plot footprints.
Since all ground plans in the different time layers have been recorded into the GIS (for example, almost 25.000 for 2017), additional historical data can be linked to each building.
Connecting historical data with geolocated structures
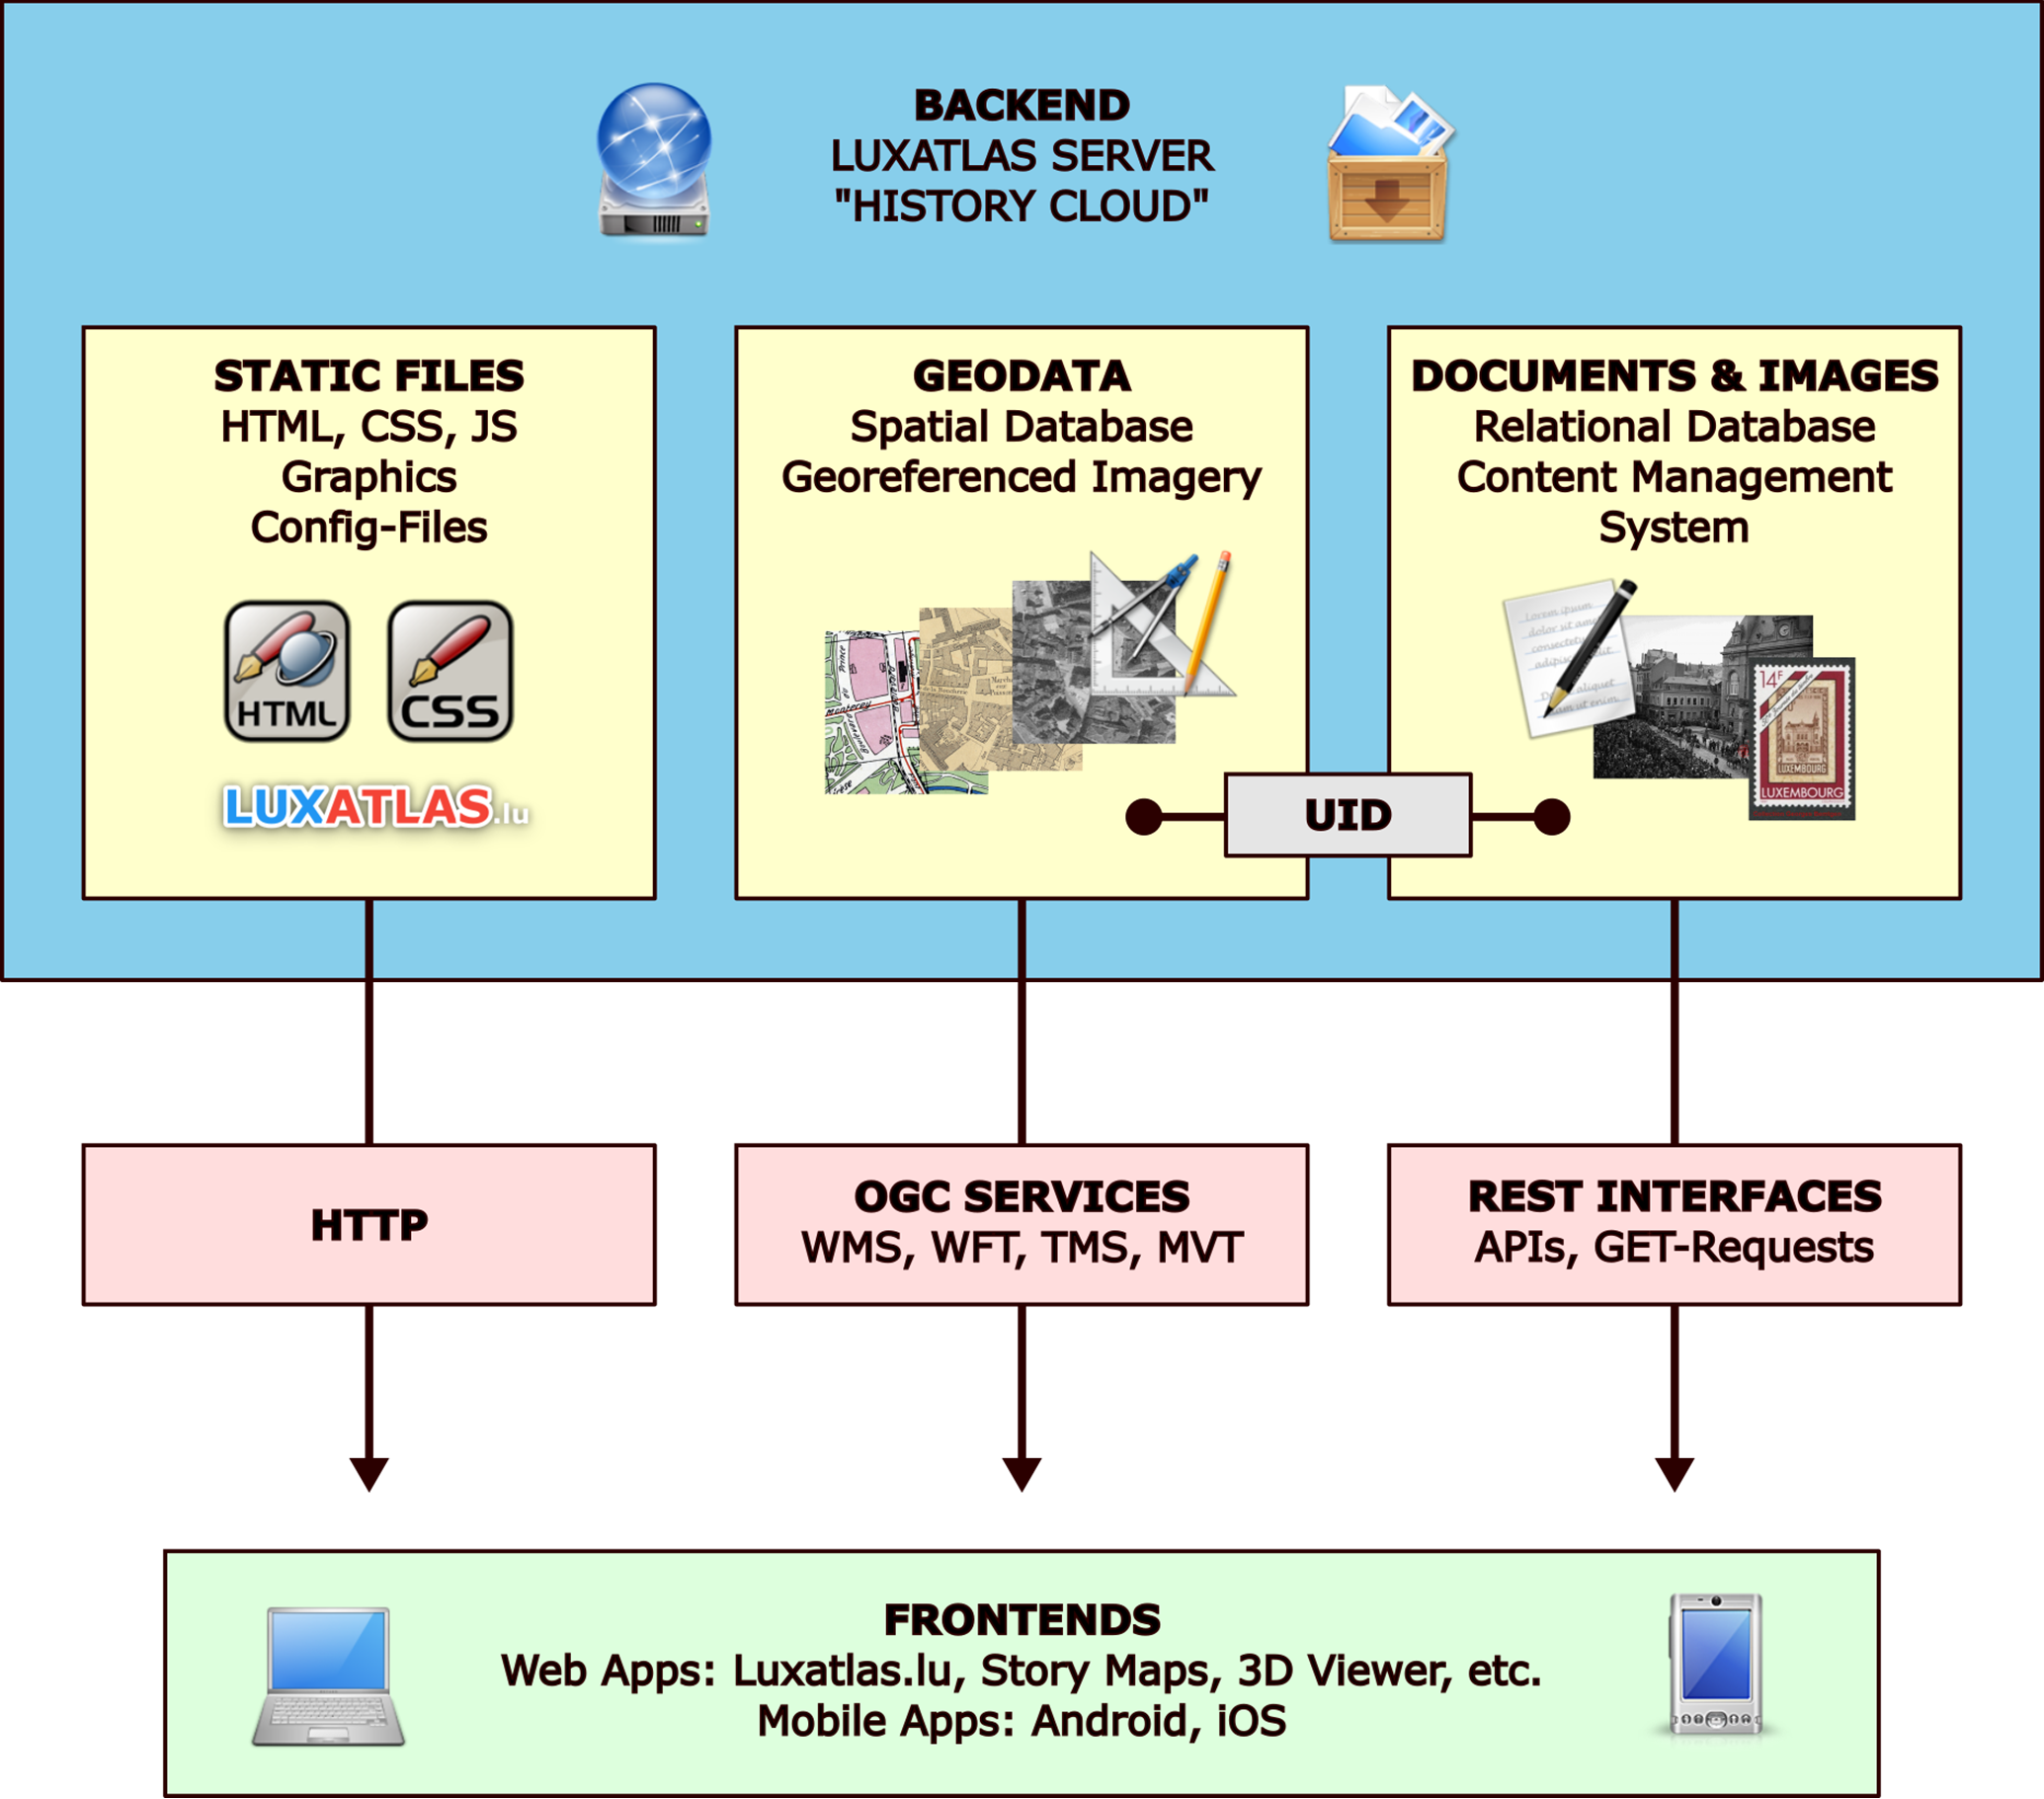
Within the second part, an infrastructure has been set up connecting centralized data storage (backend) through an easy-to-use browser interface (frontend). This setup has been mainly realized considering open-source technology.
While considering centralized data storage as key for efficient cooperation between disciplines, a clear distinction between systems and tasks on all levels has been realized. The system is in a constant process of optimization including user feedback.
The implementation of historical information (explanatory texts, chronological tables, images) for selected buildings and infrastructures with a particular historical relevance and for specific thematic story maps is still ongoing.
In addition to geolocated structures (2D), research on the preparation and implementation of a vertical dimension (3D) is currently taking place.
Luxatlas as Local Time Machine Project
Visit Luxatlas on our Local Time Machine platform to learn more (website, project partners etc.) and make sure to follow the project on social media.